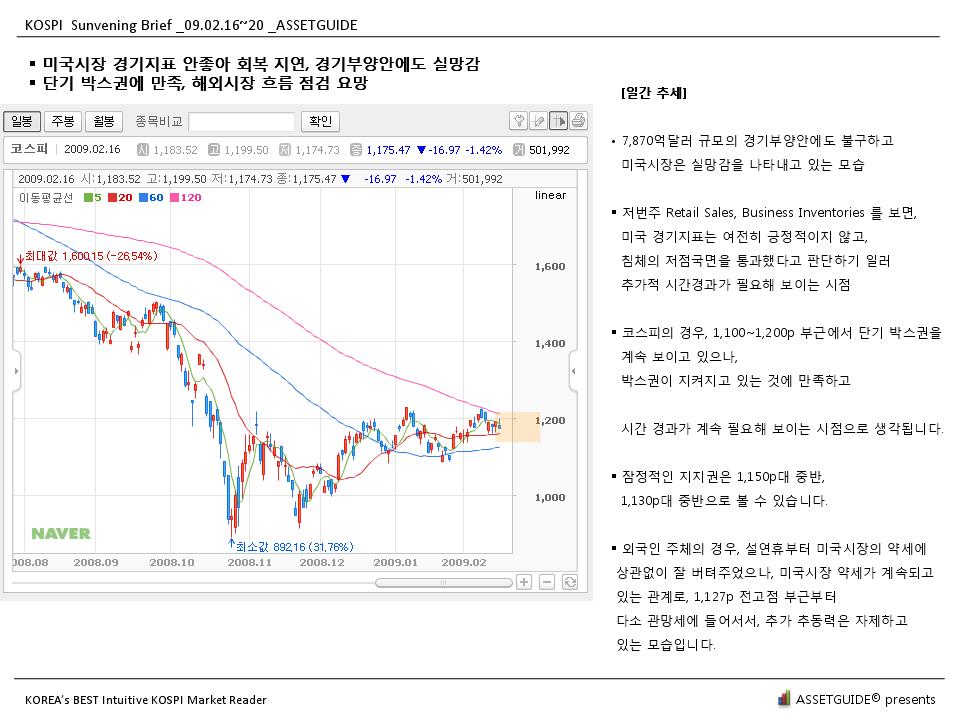
미국 소매판매, Retail Sales 지표가 월간 -1.1% 다시 감소하였고, 결국 근래 2개월간 소폭 개선되는 듯 했으나,
침체 흐름의 일시적 기술적 둔화에 불과하고, 다시 침체가 지속되는 흐름을 보여주고 있습니다.
장기 침체가 연장되는 흐름으로 경계와 충분한 시간 경과가 필요하다고 생각됩니다.
FOR IMMEDIATE RELEASE
TUESDAY, APRIL 14, AT 8:30 A.M. EDT
Timothy Winters / Aneta Erdie CB09-51
Service Sector Statistics Division
(301) 763-2713
ADVANCE MONTHLY SALES FOR RETAIL TRADE AND FOOD SERVICES
MARCH 2009
| Intention to Revise Retail Estimates: Monthly retail sales estimates will be revised based on the results of the 2007 Annual Retail Trade Survey. Revised not adjusted and corresponding adjusted data are scheduled for release on April 30, 2009. |
The U.S. Census Bureau announced today that advance estimates of U.S. retail and food services sales for March, adjusted for seasonal variation and holiday and trading-day differences, but not for price changes, were $344.4 billion, a decrease of 1.1 percent (±0.5%) from the previous month and 9.4 percent (±0.7%) below March 2008. Total sales for the January through March 2009 period were down 8.8 percent (±0.5%) from the same period a year ago. The January 2009 to February 2009 percent change was revised from -0.1 percent (±0.5%)* to +0.3 percent (±0.3%)*.
Retail trade sales were down 1.1 percent (±0.7%) from February 2009 and 10.7 percent (±0.7%) below last year. Gasoline stations sales were down 34.0 percent (±1.5%) from March 2008 and motor vehicle and parts dealers sales were down 23.5 percent (±2.3%) from last year.
The advance estimates are based on a subsample of the Census Bureau's full retail and food services sample. A stratified random sampling method is used to select approximately 5,000 retail and food services firms whose sales are then weighted and benchmarked to represent the complete universe of over three million retail and food services firms. Responding firms account for approximately 65% of the MARTS dollar volume estimate. For an explanation of the measures of sampling variability included in this report, please see the Reliability of Estimates section on the last page of this publication.
Percent Change in Retail and Food Services Sales
(Estimates adjusted for seasonal variation, holiday, and trading-day differences, but not for price changes)

The Advance Monthly Retail Sales for Retail and Food Services for April is scheduled to be released May 13, 2009 at 8:30 a.m. EDT.
For information, visit the Census Bureau's Web site at <http://www.census.gov/retail>. This report is also available the day of issue through the Department of Commerce's STAT-USA (202-482-1986).
* The 90 percent confidence interval includes zero. The Census Bureau does not have sufficient statistical evidence to conclude that the actual change is different than zero.
TABLE 1A. ESTIMATED MONTHLY SALES FOR RETAIL AND FOOD SERVICES, BY KIND OF BUSINESS--March 2009
Estimates adjusted for seasonal variations and holiday and trading-day differences, but not for price changes.
(Total sales estimates are shown in millions of dollars and are based on data from the Advance Monthly Retail Trade Survey, Monthly Retail Trade Survey, and administrative records.)(2)
(In Millions of dollars)
2009 2009 2009 2008 2008
NAICS(1) Kind of Business Mar(3) Feb Jan Mar Feb
Code (a) (p) (r) (r) (r)
Retail & food services, total.................... 344,380 348,359 347,311 380,171 378,191
Total (excl. motor vehicle & parts)............ 288,203 290,844 288,038 306,746 304,410
Retail ....................................... 305,830 309,246 308,613 342,444 340,684
GAFO(4).......................................... (*) 96,663 95,550 98,272 97,271
441 Motor vehicle & parts dealers.................... 56,177 57,515 59,273 73,425 73,781
4411,4412 Auto & other motor veh. dealers................. 49,659 50,926 52,720 67,011 67,405
442 Furniture & home furnishings stores.............. 8,231 8,370 8,326 9,467 9,445
443 Electronics & appliance stores.................... 8,535 9,066 9,007 9,427 9,199
44311,13 Appl., T.V. & camera........................... (*) 7,279 7,254 7,609 7,375
44312 Computer & software stores...................... (*) 1,787 1,753 1,818 1,824
444 Building material & garden eq. & supplies dealers 24,488 24,645 24,762 26,971 27,538
4441 Building mat. & supplies dealers................ (*) 20,585 20,590 22,998 23,608
445 Food & beverage stores........................... 49,469 49,239 49,308 48,671 48,367
4451 Grocery stores.................................. 44,123 43,931 44,063 43,649 43,400
4453 Beer, wine & liquor stores...................... (*) 3,578 3,591 3,452 3,421
446 Health & personal care stores.................... 21,124 21,037 20,910 20,233 20,260
44611 Pharmacies & drug stores........................ (*) 17,320 17,198 16,765 16,762
447 Gasoline stations................................ 27,896 28,339 27,474 42,253 41,523
448 Clothing & clothing accessories stores........... 17,939 18,266 17,775 18,901 18,655
44811 Men's clothing stores........................... (*) (S) (S) (S) (S)
44812 Women's clothing stores......................... (*) 3,044 2,982 3,349 3,359
4482 Shoe stores..................................... (*) 2,215 2,087 2,201 2,221
451 Sporting goods, hobby, book & music stores....... 7,287 7,355 7,350 7,396 7,311
452 General merchandise stores....................... 50,146 50,229 49,643 49,509 49,204
4521 Department stores (ex. L.D.).................... 16,057 16,106 15,965 16,990 17,103
4521 Department stores (incl. L.D.)(5)............... (*) (NA) (NA) (NA) (NA)
4529 Other general merchandise stores................ (*) 34,123 33,678 32,519 32,101
45291 Warehouse clubs & supercenters................. (*) 30,253 29,954 28,875 28,385
45299 All other gen. merchandise stores.............. (*) 3,870 3,724 3,644 3,716
453 Miscellaneous store retailers.................... 9,519 9,736 9,214 9,867 9,715
454 Nonstore retailers............................... 25,019 25,449 25,571 26,324 25,686
4541 Electronic shopping & mail-order houses......... (*) 18,264 18,301 17,912 17,504
722 Food services & drinking places.................. 38,550 39,113 38,698 37,727 37,507
(*) Advance estimates are not available for this kind of business.
(NA) Not available (S) Suppressed (a) Advance estimate (p) Preliminary estimate (r) Revised estimate
(1) For a full description of the NAICS codes used in this table, see http://www.census.gov/epcd/www/naics.html
(2) Estimates are concurrently adjusted for seasonal variation and for holiday and trading day differences, but not for price changes. Concurrent seasonal adjustment
uses all available unadjusted estimates as input to the X-12 ARIMA program. The factors derived from the program are used in calculating all seasonally
adjusted estimates shown in this table. Year-to-date seasonally adjusted sales estimates are not tabulated. Adjustment factors and explanatory material can be found
on the Internet at http://www.census.gov/mrts/www/mrts.html
(3) Advance estimates are based on early reports obtained from a small sample of firms selected from the larger Monthly Retail Trade Survey (MRTS) sample.
All other estimates are from the MRTS sample.
(4) GAFO represents firms which specialize in department store types of merchandise and is comprised of furniture & home furnishings (442), electronics & appliances (443),
clothing & clothing accessories (448), sporting goods, hobby, book, and music (451), general merchandise (452), office supply, stationery, and gift stores (4532).
(5) Estimates include data for leased departments operated within department stores. Data for this line are not included in broader kind-of-business totals.
TABLE 1B. ESTIMATED MONTHLY SALES FOR RETAIL AND FOOD SERVICES, BY KIND OF BUSINESS--March 2009
Estimates not adjusted for seasonal variations and holiday and trading-day differences and price changes.
(In Millions of dollars and Annual Percent Change)
3 month total
% Chg. 2009 2009 2009 2008 2008
NAICS(1) Kind of Business 2009 from Mar(2) Feb Jan Mar Feb
Code 2008 (a) (p) (r)
Retail & food services, total.................... 966,116 -10.1 338,716 308,599 318,801 378,755 348,876
Total (excl. motor vehicle & parts)............ 800,901 -6.8 278,617 255,952 266,332 300,572 278,636
Retail ....................................... 854,825 -11.5 299,742 273,006 282,077 340,236 313,244
GAFO(3).......................................... (*) (*) (*) 83,579 84,003 93,727 87,385
441 Motor vehicle & parts dealers.................... 165,215 -23.2 60,099 52,647 52,469 78,183 70,240
4411,4412 Auto & other motor veh. dealers................. 146,785 -25.5 53,483 46,750 46,552 71,769 64,304
44111 New car dealers................................ (*) (*) (*) 35,603 36,334 56,849 51,188
4413 Auto parts, acc. & tire stores.................. (*) (*) (*) 5,897 5,917 6,414 5,936
442 Furniture & home furnishings stores.............. 23,094 -13.9 7,951 7,466 7,677 9,136 8,822
4421 Furniture stores................................ (*) (*) (*) 4,434 4,370 5,100 5,063
4422 Home furnishings stores......................... (*) (*) (*) 3,032 3,307 4,036 3,759
443 Electronics & appliance stores.................... 24,895 -5.5 7,796 8,492 8,607 8,659 8,857
44311,13 Appl., T.V. & camera........................... (*) (*) (*) 6,857 6,964 6,886 7,146
44312 Computer & software stores...................... (*) (*) (*) 1,635 1,643 1,773 1,711
444 Building material & garden eq. & supplies dealers 61,313 -11.6 23,741 18,528 19,044 25,703 21,783
4441 Building mat. & supplies dealers................ (*) (*) (*) 16,015 16,616 21,802 19,264
445 Food & beverage stores........................... 140,814 -0.1 47,673 44,392 48,749 48,557 45,351
4451 Grocery stores.................................. 127,060 -0.5 42,888 39,933 44,239 43,824 40,970
4453 Beer, wine & liquor stores...................... (*) (*) (*) 2,959 3,106 3,176 2,976
446 Health & personal care stores.................... 62,399 2.2 21,504 19,985 20,910 20,779 20,078
44611 Pharmacies & drug stores........................ (*) (*) (*) 16,558 17,370 17,184 16,712
447 Gasoline stations................................ 76,454 -34.1 27,115 24,145 25,194 41,281 36,789
448 Clothing & clothing accessories stores........... 45,569 -6.4 16,541 15,171 13,857 18,119 16,128
44811 Men's clothing stores........................... (*) (*) (*) 623 652 816 722
44812 Women's clothing stores......................... (*) (*) (*) 2,417 2,299 3,406 2,785
44814 Family clothing stores.......................... (*) (*) (*) 5,713 5,461 6,751 5,680
4482 Shoe stores..................................... (*) (*) (*) 1,918 1,663 2,285 1,999
451 Sporting goods, hobby, book & music stores....... 19,367 -1.8 6,449 5,752 7,166 6,649 6,024
452 General merchandise stores....................... 133,847 -0.3 46,841 43,611 43,395 47,929 44,205
4521 Department stores (ex. L.D.).................... 40,277 -8.1 14,407 13,169 12,701 15,938 14,490
4521 Department stores (incl. L.D.)(4)............... (*) (*) (*) 13,523 13,038 16,384 14,891
4529 Other general merchandise stores................ (*) (*) (*) 30,442 30,694 31,991 29,715
45291 Warehouse clubs & supercenters................. (*) (*) (*) 27,137 27,618 28,442 26,426
45299 All other gen. merchandise stores.............. (*) (*) (*) 3,305 3,076 3,549 3,289
453 Miscellaneous store retailers.................... 26,010 -5.4 8,972 8,620 8,418 9,224 9,025
454 Nonstore retailers............................... 75,848 -4.7 25,060 24,197 26,591 26,017 25,942
4541 Electronic shopping & mail-order houses......... (*) (*) (*) 16,346 17,843 16,855 16,401
722 Food services & drinking places.................. 111,291 2.0 38,974 35,593 36,724 38,519 35,632
(*) Advance estimates are not available for this kind of business.
(NA) Not available (a) Advance estimate (p) Preliminary estimate (r) Revised estimate
(1) For a full description of the NAICS codes used in this table, see http://www.census.gov/epcd/www/naics.html
(2) Advance estimates are based on early reports obtained from a small sample of firms selected from the larger Monthly Retail Trade Survey (MRTS) sample.
All other estimates are from the MRTS sample.
(3) GAFO represents firms which specialize in department store types of merchandise and is comprised of furniture & home furnishings (442), electronics & appliances (443),
clothing & clothing accessories (448), sporting goods, hobby, book, and music (451), general merchandise (452), office supply, stationery, and gift stores (4532).
(4) Estimates include data for leased departments operated within department stores. Data for this line are not included in broader kind-of-business totals.
TABLE 2A. ESTIMATED CHANGE IN SALES FOR RETAIL AND FOOD SERVICES, BY KIND OF BUSINESS--March 2009
Estimates adjusted for seasonal variations and holiday and trading-day differences, but not for price changes
(Estimates are shown as percents and are based on data from the Advance Monthly Retail Trade Survey,
Monthly Retail Trade Survey, and administrative records.)(*)
Mar Feb
2009 2009
adv. prel.
from-- from--
NAICS Kind of Business Feb Mar Jan Feb
Code 2009 2008 2009 2008
(p) (r) (r) (r)
Retail & food Services, total.................... -1.1 -9.4 +0.3 -7.9
Total (excl. motor vehicle & parts ).......... -0.9 -6.0 +1.0 -4.5
Retail .................................. -1.1 -10.7 +0.2 -9.2
441 Motor vehicle & parts dealers.................... -2.3 -23.5 -3.0 -22.0
4411,4412 Auto & other motor veh. dealers............... -2.5 -25.9 -3.4 -24.4
442 Furniture & home furnishings stores.............. -1.7 -13.1 +0.5 -11.4
443 Electronics & appliance stores................... -5.9 -9.5 +0.7 -1.4
444 Building material & garden eq. & supplies dealers -0.6 -9.2 -0.5 -10.5
445 Food & beverage stores........................... +0.5 +1.6 -0.1 +1.8
4451 Grocery stores.................................. +0.4 +1.1 -0.3 +1.2
446 Health & personal care stores.................... +0.4 +4.4 +0.6 +3.8
447 Gasoline stations................................ -1.6 -34.0 +3.1 -31.8
448 Clothing & clothing accessories stores........... -1.8 -5.1 +2.8 -2.1
451 Sporting goods, hobby, book & music stores........ -0.9 -1.5 +0.1 +0.6
452 General merchandise stores....................... -0.2 +1.3 +1.2 +2.1
4521 Department stores (ex. L.D.).................... -0.3 -5.5 +0.9 -5.8
453 Miscellaneous stores retailers................... -2.2 -3.5 +5.7 +0.2
454 Nonstore retailers............................... -1.7 -5.0 -0.5 -0.9
722 Food services & drinking places.................. -1.4 +2.2 +1.1 +4.3
(p) Preliminary estimate (r) Revised estimate
(*) Estimates shown in this table are derived from adjusted estimates provided in Table 1A of this report.
TABLE 2B. ESTIMATED CHANGE IN SALES FOR RETAIL AND FOOD SERVICES, BY KIND OF BUSINESS--March 2009
Data not adjusted for seasonal variations and holiday and trading-day differences and price changes.
(Estimates are shown as percents and are based on data from the Advance Monthly Retail Trade Survey,
Monthly Retail Trade Survey, and administrative records.)(*)
Mar Feb
2009 2009
adv. prel.
from-- from--
NAICS Kind of Business Feb Mar Jan Feb
Code 2009 2008 2009 2008
(p) (r) (r) (r)
Retail & food Services, total.................... +9.8 -10.6 -3.2 -11.5
Total (excl. motor vehicle & parts ).......... +8.9 -7.3 -3.9 -8.1
Retail .................................. +9.8 -11.9 -3.2 -12.8
441 Motor vehicle & parts dealers.................... +14.2 -23.1 +0.3 -25.0
4411,4412 Auto & other motor veh. dealers................ +14.4 -25.5 +0.4 -27.3
442 Furniture & home furnishings stores.............. +6.5 -13.0 -2.7 -15.4
443 Electronics & appliance stores................... -8.2 -10.0 -1.3 -4.1
444 Building material & garden eq. & supplies dealers +28.1 -7.6 -2.7 -14.9
445 Food & beverage stores........................... +7.4 -1.8 -8.9 -2.1
4451 Grocery stores.................................. +7.4 -2.1 -9.7 -2.5
446 Health & personal care stores.................... +7.6 +3.5 -4.4 -0.5
447 Gasoline stations................................ +12.3 -34.3 -4.2 -34.4
448 Clothing & clothing accessories stores........... +9.0 -8.7 +9.5 -5.9
451 Sporting goods, hobby, book & music stores........ +12.1 -3.0 -19.7 -4.5
452 General merchandise stores....................... +7.4 -2.3 +0.5 -1.3
4521 Department stores (ex. L.D.).................... +9.4 -9.6 +3.7 -9.1
453 Miscellaneous stores retailers................... +4.1 -2.7 +2.4 -4.5
454 Nonstore retailers............................... +3.6 -3.7 -9.0 -6.7
722 Food services & drinking places.................. +9.5 +1.2 -3.1 -0.1
(p) Preliminary estimate (r) Revised estimate
(*) Estimates shown in this table are derived from not adjusted estimates provided in Table 1B of this report.
SOURCE: Advance Monthly Sales for Retail Trade and Food Services--MARCH 2009 (Press Release available without charge from Public Information Office, Bureau of the Census Washington, D.C. 20233). Survey methodology and measures of sampling variability are documented in the Advance Press Release. Questions concerning this report should be directed to
Mr. Timothy Winters (301) 763-2713.
Survey Description
The U.S. Census Bureau conducts the Advance Monthly Retail Trade and Food Services Survey (MARTS) to provide an early estimate of monthly sales by kind of business for retail and food service firms located in the United States. Each month, questionnaires are mailed to a probability sample of approximately 5,000 employer firms selected from the larger Monthly Retail Trade Survey (MRTS). Firms responding to MARTS account for approximately 65% of the total national sales estimate. Advance sales estimates are computed using a link relative estimator. The change in sales from the previous month is estimated using only units that have reported data for both the current and previous month. There is no imputation or adjustment for nonrespondents in MARTS. The total sales estimate is derived by multiplying this ratio by the preliminary sales estimate for the previous month (derived from the larger MRTS sample). Detailed industry estimates are summed to derive total estimates at broad industry levels. The monthly estimates are adjusted using annual survey estimates and for seasonal variation and holiday and trading-day differences. Additional information on MARTS and MRTS can be found on the Census Bureau website at:
http://www.census.gov/mrts/www/mrts.html.
Reliability of Estimates
Because the estimates presented in this report are based on a sample survey, they contain sampling error and nonsampling error. Sampling error is the difference between the estimate and the result that would be obtained from a complete enumeration of the sampling frame conducted under the same survey conditions. This error occurs because only a subset of the entire sampling frame is measured in a sample survey. Standard errors and coefficients of variation (CV), as given in Table 3 of this report, are estimated measures of sampling variation. The margin of sampling error, as used on page 1, gives a range about the estimate which is 90-percent confidence interval. If, for example, the percent change estimate is +1.2 percent and its estimated standard error is 0.9 percent, then the margin of sampling error is ±1.65 x 0.9 percent or ±1.5 percent, and the 90 percent confidence interval is -0.3 percent to +2.7 percent. If the interval contains 0, then one does not have sufficient statistical evidence to conclude at the 90 percent confidence level that the change is different from zero and therefore the change is not statistically significant. Estimated changes shown in the text are statistically significant unless otherwise noted. For a monthly total, the median estimated coefficient of variation is given. The resulting confidence interval is the estimated value ±1.65 x CV x (the estimated monthly total). The Census Bureau recommends that individuals using estimates in this report incorporate this information into their analyses, as sampling error could affect the conclusions drawn from the estimates. Nonsampling error encompasses all other factors that contribute to the total error of a sample survey estimate. This type of error can occur because of nonresponse, insufficient coverage of the universe of retail businesses, mistakes in the recording and coding of data, and other errors of collection, response, coverage, or processing. Although nonsampling error is not measured directly, the Census Bureau employs quality control procedures throughout the process to minimize this type of error.

(1) Estimated measures of sampling variability are based on estimates not adjusted for seasonal variation, or holiday, or trading-day differences. Medians are based on estimates for the most recent 12 months.
(2) These columns provide measures of the difference between the advance-to-preliminary and preliminary-to-final estimates of month-to-month change for the same pair of months as measured by the Advance sample and MRTS sample. The average and median differences are based on estimates for the most recent 12 months.
Note: Additional information on confidentiality protection, sampling error, nonsampling error, sample design, and definitions may be found at
http://www.census.gov/mrts/www/mrts.html
 Current Quarter Retail E-Commerce Sales
Source: Retail Indicators Branch, U.S. Census Bureau | Last Revised: April 14, 2009