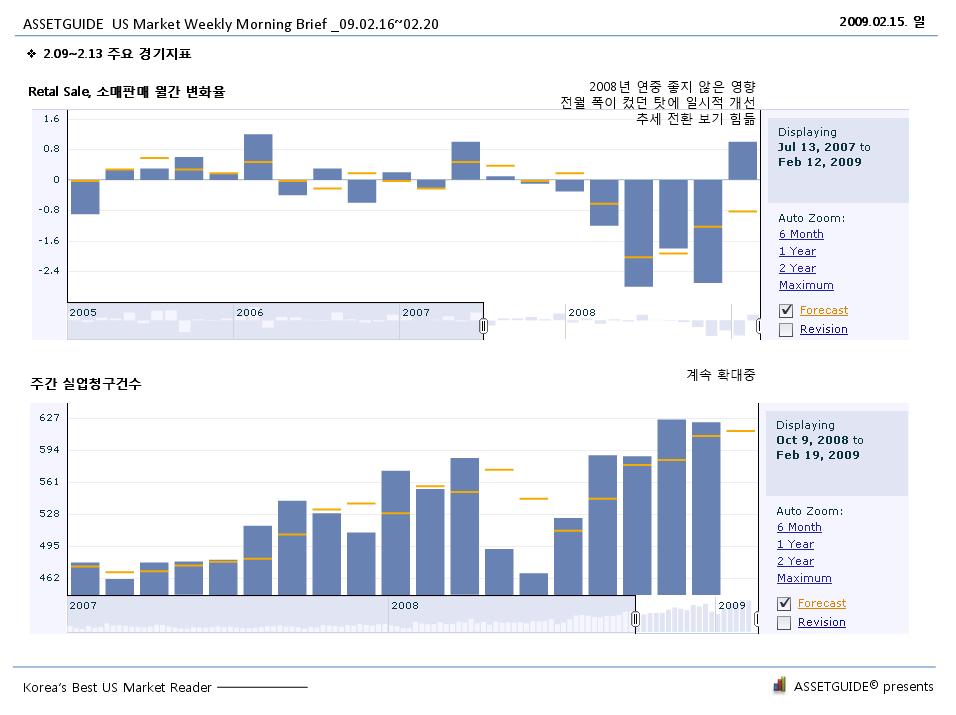
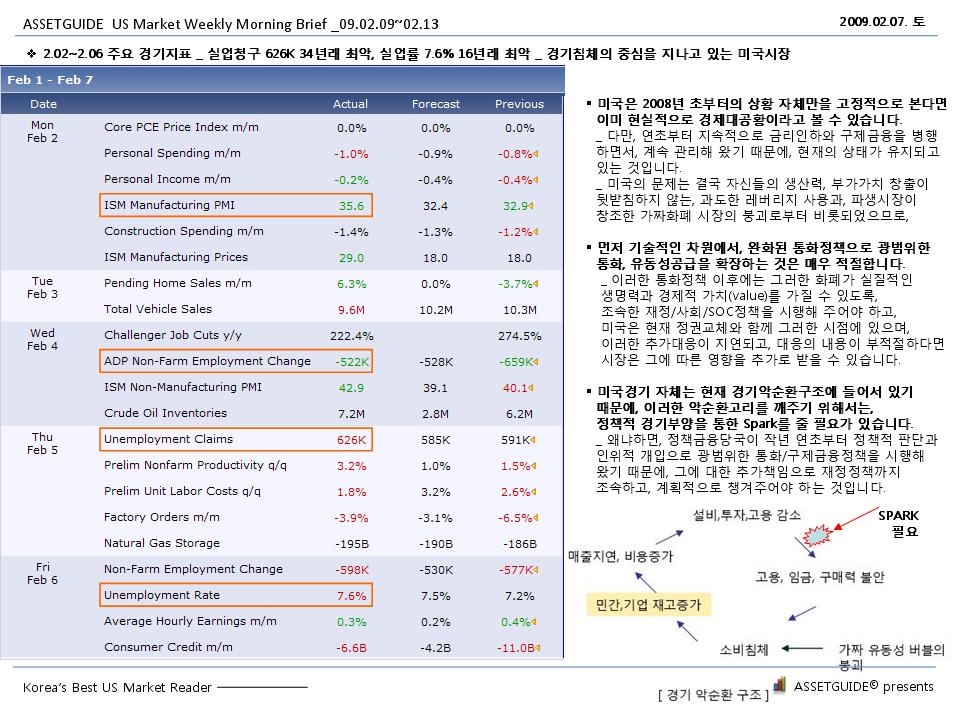
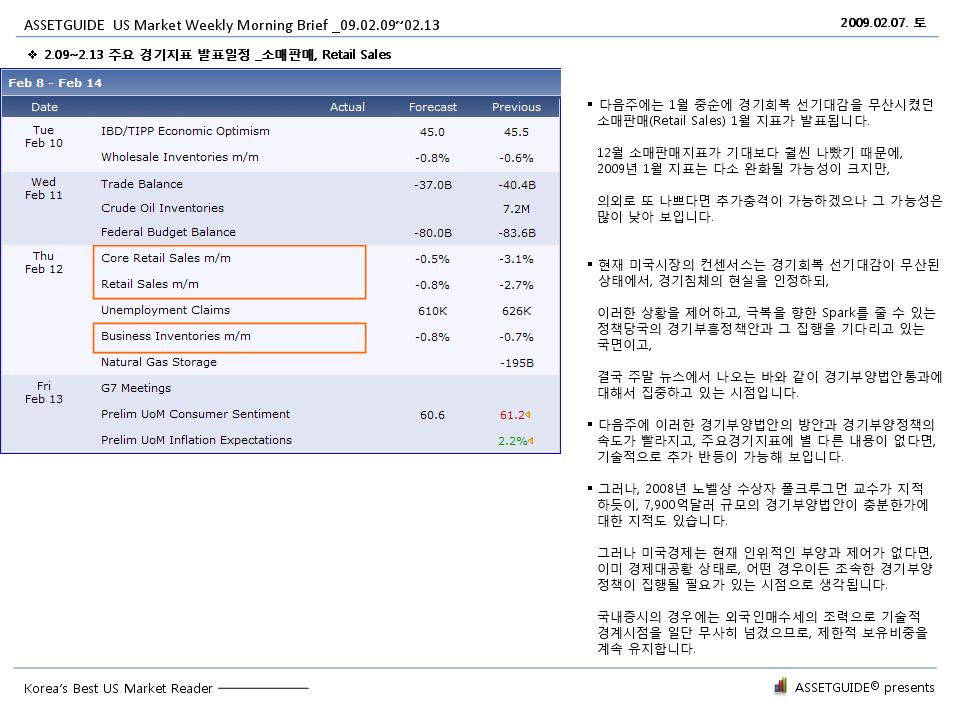
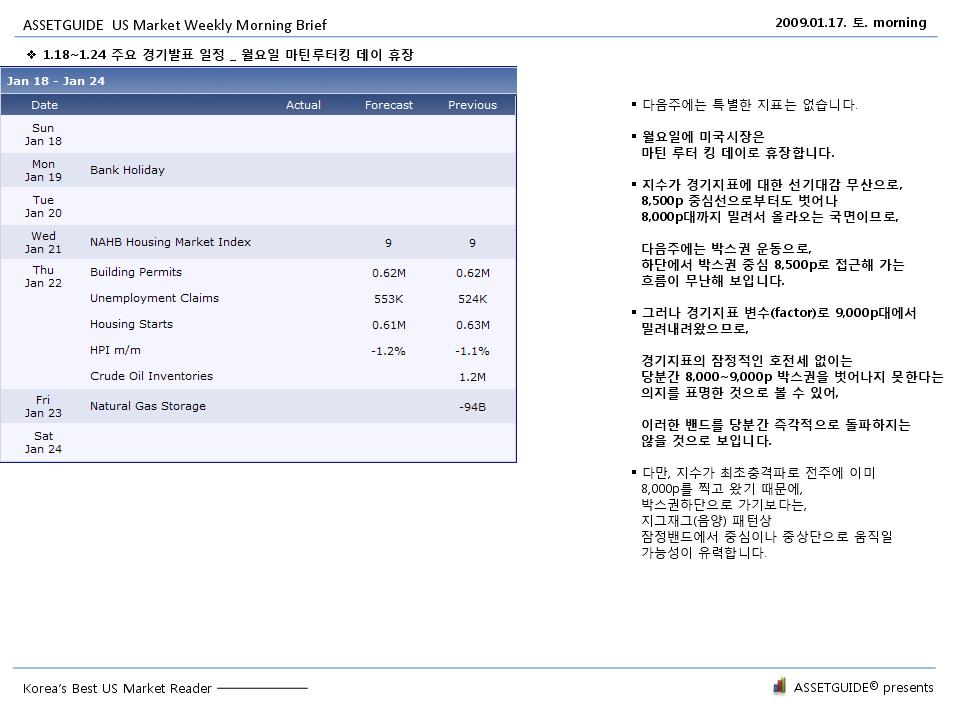
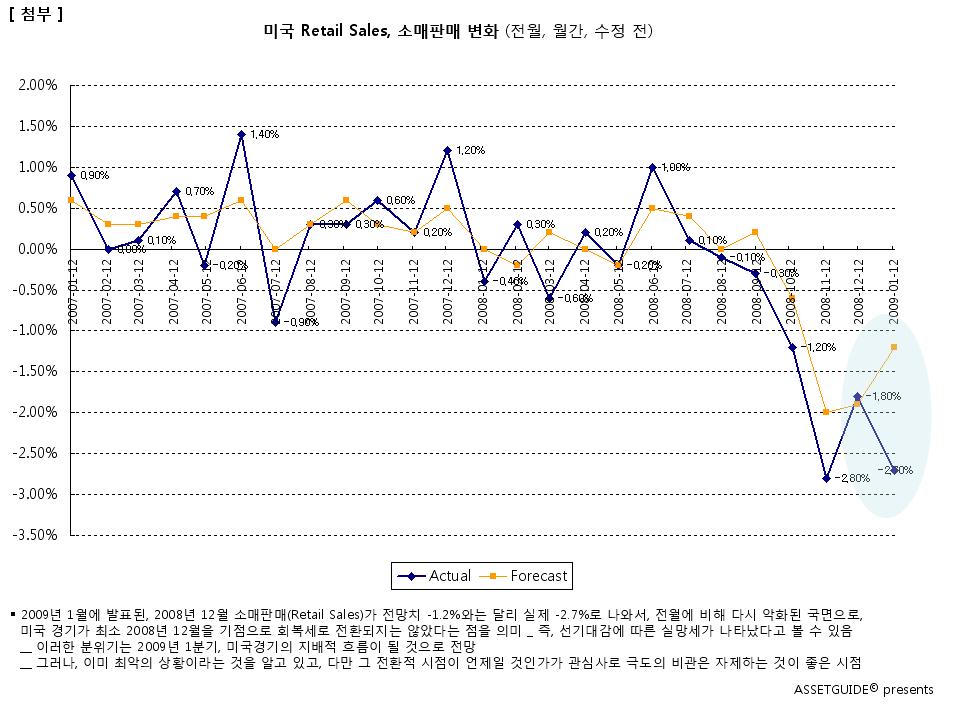
다음은 미국 소매판매, Retail Sales 월간변화율입니다. 저번달에 소매판매율(-3.0%, adjusted)이 기대치에 미치지 못하면서 시장충격을 주었으나, 이번달에 발표된 1월 소매판매율은 +1.0% 상승하여 개선세가 나타났지만, 저번달의 소매판매율이 -3.0%로 큰 탓이 있었기 때문에, 여전히 본격적 개선세보다는, 추가 침체의 완화 정도로 받아들이면 될 것으로 보입니다.
FOR IMMEDIATE RELEASE
THURSDAY, FEBRUARY 12, 2009 AT 8:30 A.M. EST
Timothy Winters / Aneta Erdie CB09-20
Service Sector Statistics Division
(301) 763-2713
ADVANCE MONTHLY SALES FOR RETAIL TRADE AND FOOD SERVICES
JANUARY 2009
| Intention to Revise Retail Estimates: Monthly retail sales estimates will be revised based on the results of the 2007 Annual Retail Trade Survey. Revised not adjusted and corresponding adjusted data are scheduled for release on April 30, 2009. |
The U.S. Census Bureau announced today that advance estimates of U.S. retail and food services sales for January, adjusted for seasonal variation and holiday and trading-day differences, but not for price changes, were $344.6 billion, an increase of 1.0 percent (±0.5%) from the previous month, but 9.7 percent (±0.7%) below January 2008. Total sales for the November 2008 through January 2009 period were down 9.5 percent (±0.5%) from the same period a year ago. The November to December 2008 percent change was revised from –2.7 percent (±0.5%) to –3.0 percent (±0.2%).
Retail trade sales were up 1.1 percent (±0.7%) from December 2008, but were 11.0 percent (±0.7%) below last year. Gasoline stations sales were down 35.5 percent (±1.5%) from January 2008 and motor vehicle and parts dealers sales were down 22.2 percent (±2.3%) from last year.
The advance estimates are based on a subsample of the Census Bureau's full retail and food services sample. A stratified random sampling method is used to select approximately 5,000 retail and food services firms whose sales are then weighted and benchmarked to represent the complete universe of over three million retail and food services firms. Responding firms account for approximately 65% of the MARTS dollar volume estimate. For an explanation of the measures of sampling variability included in this report, please see the Reliability of Estimates section on the last page of this publication.
Percent Change in Retail and Food Services Sales
(Estimates adjusted for seasonal variation, holiday, and trading-day differences, but not for price changes)

The Advance Monthly Retail Sales for Retail and Food Services for February is scheduled to be released March 12, 2009 at 8:30 a.m. EDT.
For information, visit the Census Bureau's Web site at <http://www.census.gov/retail>. This report is also available the day of issue through the Department of Commerce's STAT-USA (202-482-1986).
* The 90 percent confidence interval includes zero. The Census Bureau does not have sufficient statistical evidence to conclude that the actual change is different than zero.
TABLE 1A. ESTIMATED MONTHLY SALES FOR RETAIL AND FOOD SERVICES, BY KIND OF BUSINESS--January 2009
Estimates adjusted for seasonal variations and holiday and trading-day differences, but not for price changes.
(Total sales estimates are shown in millions of dollars and are based on data from the Advance Monthly Retail Trade Survey, Monthly Retail Trade Survey, and administrative records.)(2)
(In Millions of dollars)
2009 2008 2008 2008 2007
NAICS(1) Kind of Business Jan(3) Dec Nov Jan Dec
Code (a) (p) (r) (r) (r)
Retail & food services, total.................... 344,649 341,072 351,777 381,673 380,968
Total (excl. motor vehicle & parts)............ 286,003 283,348 292,852 306,246 304,440
Retail ....................................... 306,201 302,935 313,152 343,910 343,078
GAFO(4).......................................... (*) 93,334 95,394 98,425 98,066
441 Motor vehicle & parts dealers.................... 58,646 57,724 58,925 75,427 76,528
4411,4412 Auto & other motor veh. dealers................. 52,050 51,131 52,317 69,154 70,172
442 Furniture & home furnishings stores.............. 8,286 8,392 8,525 9,670 9,690
443 Electronics & appliance stores.................... 8,706 8,486 9,013 9,444 9,435
44311,13 Appl., T.V. & camera........................... (*) 6,719 7,219 7,626 7,579
44312 Computer & software stores...................... (*) 1,767 1,794 1,818 1,856
444 Building material & garden eq. & supplies dealers 24,260 25,059 25,657 27,608 27,454
4441 Building mat. & supplies dealers................ (*) 20,896 21,511 23,743 23,913
445 Food & beverage stores........................... 49,303 48,293 49,447 48,265 48,018
4451 Grocery stores.................................. 44,143 43,174 44,227 43,320 42,930
4453 Beer, wine & liquor stores...................... (*) 3,528 3,582 3,397 3,388
446 Health & personal care stores.................... 20,947 20,938 20,838 20,179 19,854
44611 Pharmacies & drug stores........................ (*) 17,330 17,243 16,701 16,499
447 Gasoline stations................................ 27,016 26,322 31,201 41,894 40,633
448 Clothing & clothing accessories stores........... 17,179 16,910 17,617 19,141 18,777
44811 Men's clothing stores........................... (*) (S) (S) (S) (S)
44812 Women's clothing stores......................... (*) 2,946 3,091 3,368 3,387
4482 Shoe stores..................................... (*) 2,113 2,154 2,245 2,221
451 Sporting goods, hobby, book & music stores....... 7,079 7,113 7,184 7,539 7,308
452 General merchandise stores....................... 49,700 49,167 49,765 48,979 49,274
4521 Department stores (ex. L.D.).................... 16,083 16,128 16,467 17,118 17,330
4521 Department stores (incl. L.D.)(5)............... (*) (NA) (NA) (NA) (NA)
4529 Other general merchandise stores................ (*) 33,039 33,298 31,861 31,944
45291 Warehouse clubs & supercenters................. (*) 29,497 29,656 28,119 28,289
45299 All other gen. merchandise stores.............. (*) 3,542 3,642 3,742 3,655
453 Miscellaneous store retailers.................... 9,262 9,384 9,540 9,984 9,948
454 Nonstore retailers............................... 25,817 25,147 25,440 25,780 26,159
4541 Electronic shopping & mail-order houses......... (*) 18,101 17,925 17,613 17,894
722 Food services & drinking places.................. 38,448 38,137 38,625 37,763 37,890
(*) Advance estimates are not available for this kind of business.
(NA) Not available (S) Suppressed (a) Advance estimate (p) Preliminary estimate (r) Revised estimate
(1) For a full description of the NAICS codes used in this table, see http://www.census.gov/epcd/www/naics.html
(2) Estimates are concurrently adjusted for seasonal variation and for holiday and trading day differences, but not for price changes. Concurrent seasonal adjustment
uses all available unadjusted estimates as input to the X-12 ARIMA program. The factors derived from the program are used in calculating all seasonally
adjusted estimates shown in this table. Year-to-date seasonally adjusted sales estimates are not tabulated. Adjustment factors and explanatory material can be found
on the Internet at http://www.census.gov/mrts/www/mrts.html
(3) Advance estimates are based on early reports obtained from a small sample of firms selected from the larger Monthly Retail Trade Survey (MRTS) sample.
All other estimates are from the MRTS sample.
(4) GAFO represents firms which specialize in department store types of merchandise and is comprised of furniture & home furnishings (442), electronics & appliances (443),
clothing & clothing accessories(448), sporting goods, hobby, book, and music (451), general merchandise(452), office supply, stationery, and gift stores(4532).
(5) Estimates include data for leased departments operated within department stores. Data for this line are not included in broader kind-of-business totals.
TABLE 1B. ESTIMATED MONTHLY SALES FOR RETAIL AND FOOD SERVICES, BY KIND OF BUSINESS--January 2009
Estimates not adjusted for seasonal variations and holiday and trading-day differences and price changes.
(In Millions of dollars and Annual Percent Change)
1 month total
% Chg. 2009 2008 2008 2008 2007
NAICS(1) Kind of Business 2009 from Jan(2) Dec Nov Jan Dec
Code 2008 (a) (p) (r)
Retail & food services, total.................... 315,603 -9.0 315,603 393,117 343,376 346,951 429,953
Total (excl. motor vehicle & parts)............ 263,882 -5.8 263,882 338,718 293,611 280,111 360,089
Retail ....................................... 279,270 -10.5 279,270 354,751 306,489 312,020 391,457
GAFO(3).......................................... (*) (*) (*) 137,607 103,990 84,711 146,167
441 Motor vehicle & parts dealers.................... 51,721 -22.6 51,721 54,399 49,765 66,840 69,864
4411,4412 Auto & other motor veh. dealers................. 45,752 -25.1 45,752 48,063 43,580 61,063 63,997
44111 New car dealers................................ (*) (*) (*) 38,838 34,724 49,443 53,038
4413 Auto parts, acc. & tire stores.................. (*) (*) (*) 6,336 6,185 5,777 5,867
442 Furniture & home furnishings stores.............. 7,623 -13.9 7,623 9,836 9,071 8,858 11,172
4421 Furniture stores................................ (*) (*) (*) 4,638 4,617 4,989 5,329
4422 Home furnishings stores......................... (*) (*) (*) 5,198 4,454 3,869 5,843
443 Electronics & appliance stores.................... 8,177 -7.4 8,177 13,879 10,277 8,832 15,292
44311,13 Appl., T.V. & camera........................... (*) (*) (*) 11,079 8,266 7,092 12,430
44312 Computer & software stores...................... (*) (*) (*) 2,800 2,011 1,740 2,862
444 Building material & garden eq. & supplies dealers 18,518 -15.5 18,518 22,271 23,374 21,906 23,429
4441 Building mat. & supplies dealers................ (*) (*) (*) 19,036 19,962 19,707 20,780
445 Food & beverage stores........................... 48,612 3.5 48,612 52,514 49,444 46,981 52,470
4451 Grocery stores.................................. 44,231 3.2 44,231 45,505 44,139 42,843 45,463
4453 Beer, wine & liquor stores...................... (*) (*) (*) 4,773 3,629 2,830 4,611
446 Health & personal care stores.................... 20,926 3.5 20,926 23,618 19,879 20,219 21,839
44611 Pharmacies & drug stores........................ (*) (*) (*) 19,288 16,450 16,968 17,951
447 Gasoline stations................................ 24,828 -34.5 24,828 24,953 28,674 37,914 38,358
448 Clothing & clothing accessories stores........... 13,300 -8.0 13,300 27,445 19,185 14,459 31,235
44811 Men's clothing stores........................... (*) (*) (*) 1,215 863 731 1,491
44812 Women's clothing stores......................... (*) (*) (*) 4,222 3,304 2,570 4,904
44814 Family clothing stores.......................... (*) (*) (*) 10,805 7,984 5,325 11,283
4482 Shoe stores..................................... (*) (*) (*) 2,751 2,165 1,744 2,936
451 Sporting goods, hobby, book & music stores....... 6,725 -4.6 6,725 12,021 7,479 7,049 12,072
452 General merchandise stores....................... 43,514 3.5 43,514 69,687 54,754 42,052 71,346
4521 Department stores (ex. L.D.).................... 12,819 -4.4 12,819 27,505 19,634 13,412 29,700
4521 Department stores (incl. L.D.)(4)............... (*) (*) (*) 28,230 20,192 13,790 30,490
4529 Other general merchandise stores................ (*) (*) (*) 42,182 35,120 28,640 41,646
45291 Warehouse clubs & supercenters................. (*) (*) (*) 36,989 31,139 25,504 36,266
45299 All other gen. merchandise stores.............. (*) (*) (*) 5,193 3,981 3,136 5,380
453 Miscellaneous store retailers.................... 8,396 -9.3 8,396 11,264 9,134 9,253 11,687
454 Nonstore retailers............................... 26,930 -2.6 26,930 32,864 25,453 27,657 32,693
4541 Electronic shopping & mail-order houses......... (*) (*) (*) 24,400 17,961 17,507 23,030
722 Food services & drinking places.................. 36,333 4.0 36,333 38,366 36,887 34,931 38,496
(*) Advance estimates are not available for this kind of business.
(NA) Not available (a) Advance estimate (p) Preliminary estimate (r) Revised estimate
(1) For a full description of the NAICS codes used in this table, see http://www.census.gov/epcd/www/naics.html
(2) Advance estimates are based on early reports obtained from a small sample of firms selected from the larger Monthly Retail Trade Survey (MRTS) sample.
All other estimates are from the MRTS sample.
(3) GAFO represents firms which specialize in department store types of merchandise and is comprised of furniture & home furnishings (442), electronics & appliances (443),
clothing & clothing accessories(448), sporting goods, hobby, book, and music (451), general merchandise(452), office supply, stationery, and gift stores(4532).
(4) Estimates include data for leased departments operated within department stores. Data for this line are not included in broader kind-of-business totals.
TABLE 2A. ESTIMATED CHANGE IN SALES FOR RETAIL AND FOOD SERVICES, BY KIND OF BUSINESS--January 2009
Estimates adjusted for seasonal variations and holiday and trading-day differences, but not for price changes
(Estimates are shown as percents and are based on data from the Advance Monthly Retail Trade Survey,
Monthly Retail Trade Survey, and administrative records.)(*)
Jan Dec
2009 2008
adv. prel.
from-- from--
NAICS Kind of Business Dec Jan Nov Dec
Code 2008 2008 2008 2007
(p) (r) (r) (r)
Retail & food Services, total.................... +1.0 -9.7 -3.0 -10.5
Total (excl. motor vehicle & parts ).......... +0.9 -6.6 -3.2 -6.9
Retail .................................. +1.1 -11.0 -3.3 -11.7
441 Motor vehicle & parts dealers.................... +1.6 -22.2 -2.0 -24.6
4411,4412 Auto & other motor veh. dealers............... +1.8 -24.7 -2.3 -27.1
442 Furniture & home furnishings stores.............. -1.3 -14.3 -1.6 -13.4
443 Electronics & appliance stores................... +2.6 -7.8 -5.8 -10.1
444 Building material & garden eq. & supplies dealers -3.2 -12.1 -2.3 -8.7
445 Food & beverage stores........................... +2.1 +2.2 -2.3 +0.6
4451 Grocery stores.................................. +2.2 +1.9 -2.4 +0.6
446 Health & personal care stores.................... 0.0 +3.8 +0.5 +5.5
447 Gasoline stations................................ +2.6 -35.5 -15.6 -35.2
448 Clothing & clothing accessories stores........... +1.6 -10.3 -4.0 -9.9
451 Sporting goods, hobby, book & music stores........ -0.5 -6.1 -1.0 -2.7
452 General merchandise stores....................... +1.1 +1.5 -1.2 -0.2
4521 Department stores (ex. L.D.).................... -0.3 -6.0 -2.1 -6.9
453 Miscellaneous stores retailers................... -1.3 -7.2 -1.6 -5.7
454 Nonstore retailers............................... +2.7 +0.1 -1.2 -3.9
722 Food services & drinking places.................. +0.8 +1.8 -1.3 +0.7
(p) Preliminary estimate (r) Revised estimate
(*) Estimates shown in this table are derived from adjusted estimates provided in Table 1A of this report.
TABLE 2B. ESTIMATED CHANGE IN SALES FOR RETAIL AND FOOD SERVICES, BY KIND OF BUSINESS--January 2009
Data not adjusted for seasonal variations and holiday and trading-day differences and price changes.
(Estimates are shown as percents and are based on data from the Advance Monthly Retail Trade Survey,
Monthly Retail Trade Survey, and administrative records.)(*)
Jan Dec
2009 2008
adv. prel.
from-- from--
NAICS Kind of Business Dec Jan Nov Dec
Code 2008 2008 2008 2007
(p) (r) (r) (r)
Retail & food Services, total.................... -19.7 -9.0 +14.5 -8.6
Total (excl. motor vehicle & parts ).......... -22.1 -5.8 +15.4 -5.9
Retail .................................. -21.3 -10.5 +15.7 -9.4
441 Motor vehicle & parts dealers.................... -4.9 -22.6 +9.3 -22.1
4411,4412 Auto & other motor veh. dealers................ -4.8 -25.1 +10.3 -24.9
442 Furniture & home furnishings stores.............. -22.5 -13.9 +8.4 -12.0
443 Electronics & appliance stores................... -41.1 -7.4 +35.0 -9.2
444 Building material & garden eq. & supplies dealers -16.9 -15.5 -4.7 -4.9
445 Food & beverage stores........................... -7.4 +3.5 +6.2 +0.1
4451 Grocery stores.................................. -2.8 +3.2 +3.1 +0.1
446 Health & personal care stores.................... -11.4 +3.5 +18.8 +8.1
447 Gasoline stations................................ -0.5 -34.5 -13.0 -34.9
448 Clothing & clothing accessories stores........... -51.5 -8.0 +43.1 -12.1
451 Sporting goods, hobby, book & music stores........ -44.1 -4.6 +60.7 -0.4
452 General merchandise stores....................... -37.6 +3.5 +27.3 -2.3
4521 Department stores (ex. L.D.).................... -53.4 -4.4 +40.1 -7.4
453 Miscellaneous stores retailers................... -25.5 -9.3 +23.3 -3.6
454 Nonstore retailers............................... -18.1 -2.6 +29.1 +0.5
722 Food services & drinking places.................. -5.3 +4.0 +4.0 -0.3
(p) Preliminary estimate (r) Revised estimate
(*) Estimates shown in this table are derived from not adjusted estimates provided in Table 1B of this report.
SOURCE: Advance Monthly Sales for Retail Trade and Food Services--JANUARY 2009 (Press Release available without charge from Public Information Office, Bureau of the Census Washington, D.C. 20233). Survey methodology and measures of sampling variability are documented in the Advance Press Release. Questions concerning this report should be directed to Mr. Timothy Winters (301) 763-2713.
Survey Description
The U.S. Census Bureau conducts the Advance Monthly Retail Trade and Food Services Survey (MARTS) to provide an early estimate of monthly sales by kind of business for retail and food service firms located in the United States. Each month, questionnaires are mailed to a probability sample of approximately 5,000 employer firms selected from the larger Monthly Retail Trade Survey (MRTS). Firms responding to MARTS account for approximately 65% of the total national sales estimate. Advance sales estimates are computed using a link relative estimator. The change in sales from the previous month is estimated using only units that have reported data for both the current and previous month. There is no imputation or adjustment for nonrespondents in MARTS. The total sales estimate is derived by multiplying this ratio by the preliminary sales estimate for the previous month (derived from the larger MRTS sample). Detailed industry estimates are summed to derive total estimates at broad industry levels. The monthly estimates are adjusted using annual survey estimates and for seasonal variation and holiday and trading-day differences. Additional information on MARTS and MRTS can be found on the Census Bureau website at: http://www.census.gov/mrts/www/mrts.html.
Reliability of Estimates
Because the estimates presented in this report are based on a sample survey, they contain sampling error and nonsampling error. Sampling error is the difference between the estimate and the result that would be obtained from a complete enumeration of the sampling frame conducted under the same survey conditions. This error occurs because only a subset of the entire sampling frame is measured in a sample survey. Standard errors and coefficients of variation (CV), as given in Table 3 of this report, are estimated measures of sampling variation. The margin of sampling error, as used on page 1, gives a range about the estimate which is 90-percent confidence interval. If, for example, the percent change estimate is +1.2 percent and its estimated standard error is 0.9 percent, then the margin of sampling error is ±1.65 x 0.9 percent or ±1.5 percent, and the 90 percent confidence interval is -0.3 percent to +2.7 percent. If the interval contains 0, then one does not have sufficient statistical evidence to conclude at the 90 percent confidence level that the change is different from zero and therefore the change is not statistically significant. Estimated changes shown in the text are statistically significant unless otherwise noted. For a monthly total, the median estimated coefficient of variation is given. The resulting confidence interval is the estimated value ±1.65 x CV x (the estimated monthly total). The Census Bureau recommends that individuals using estimates in this report incorporate this information into their analyses, as sampling error could affect the conclusions drawn from the estimates. Nonsampling error encompasses all other factors that contribute to the total error of a sample survey estimate. This type of error can occur because of nonresponse, insufficient coverage of the universe of retail businesses, mistakes in the recording and coding of data, and other errors of collection, response, coverage, or processing. Although nonsampling error is not measured directly, the Census Bureau employs quality control procedures throughout the process to minimize this type of error.

(1) Estimated measures of sampling variability are based on estimates not adjusted for seasonal variation, or holiday, or trading-day differences. Medians are based on estimates for the most recent 12 months.
(2) These columns provide measures of the difference between the advance-to-preliminary and preliminary-to-final estimates of month-to-month change for the same pair of months as measured by the Advance sample and MRTS sample. The average and median differences are based on estimates for the most recent 12 months.
Note: Additional information on confidentiality protection, sampling error, nonsampling error, sample design, and definitions may be found at http://www.census.gov/mrts/www/mrts.html
 Current Quarter Retail E-Commerce Sales
Source: Retail Indicators Branch, U.S. Census Bureau | Last Revised: February 12, 2009