|
|
||||
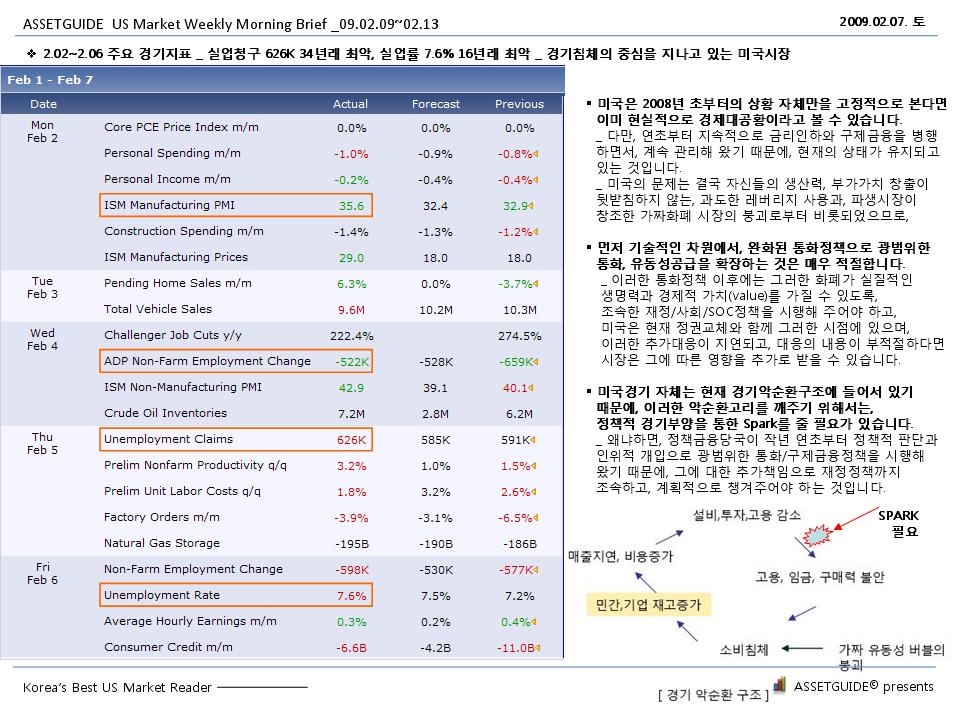
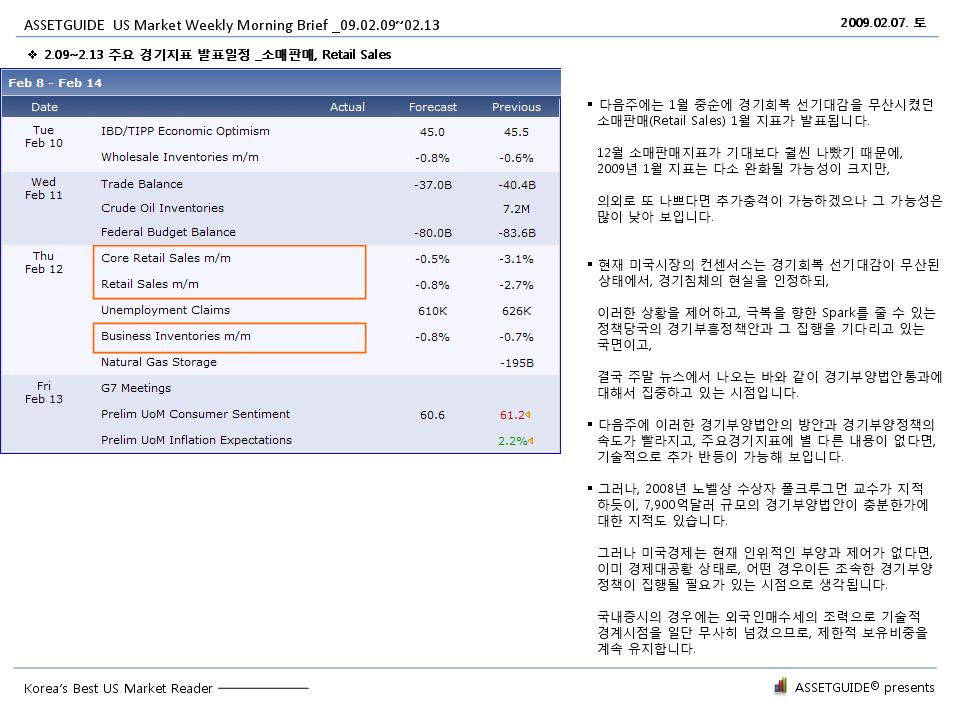
미국 주간 실업수당 청구건수 (Unemployment Claims) 가 의미있게 줄어든 것으로 나타났습니다.
7월 16일(현지) 발표된 주간 실업청구건수 내용을 보면, 550K(천명)을 예상했으나 실제로는 522K(천명)로 나타났습니다.

미국 주간 실업수당 청구건수 (단위, 천명) (forexfactory.com)
주간 실업청구건수는 '실업자'들이 미국 정부에 '실업수당'을 청구하는 주간(Weekly) 건수를 말합니다.
'Unemployment Claims'(실업청구건수) 추이를 보면, 2008년 초부터 연중으로 지속적으로 늘어나기 시작해서,
2009년 상반기에 고점권 정점을 찍은 것을 알 수 있습니다.
실업청구건수(Jobless Claims, Initial Claims)는
주간 55만~65만명 선에서 고점권을 형성한 후, 6월 경부터 한 단계 랩다운(level down)이 일어나고 있습니다.
실업수당 청구건수는 매주 집계되서 발표되며, 집계 딜레이(delay)는 약 5일이라고 합니다.
물론, 주간 실업수당 청구건수가 줄어들고 있다고 해서, 실업률이 줄어든다는 것을 의미하지는 않습니다.
다만, 실업률 증가의 가속도가 줄어들지 않을까 정도로는 받아들일 수 있겠습니다.
위처럼, 그래프 추세가 의미있게 한 단계 내려왔기 때문에, 변화된 지표의 의미는 충분히 있다고 볼 수 있겠네요.
증시는 선행 성격이 있기 때문에, 지표의 가속도(방향성)이 중요하게 작용합니다.

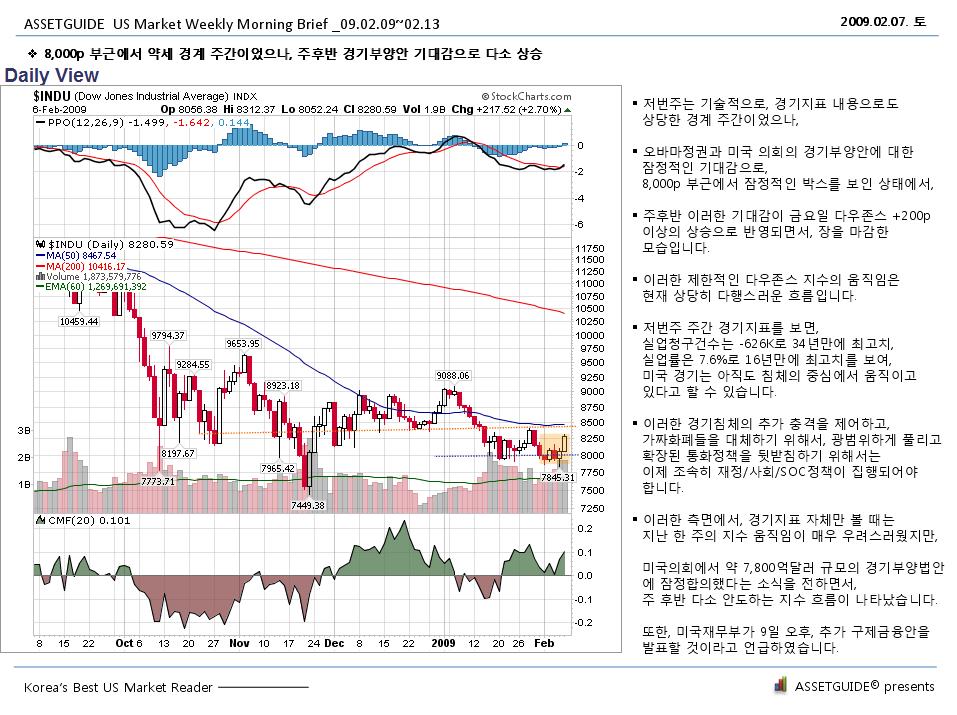
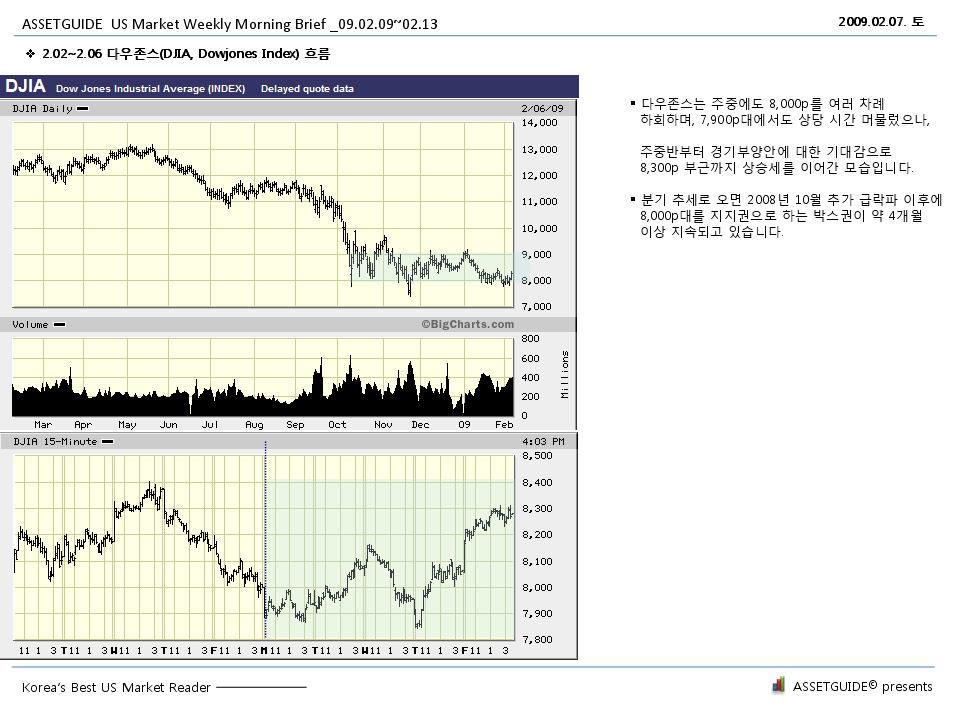
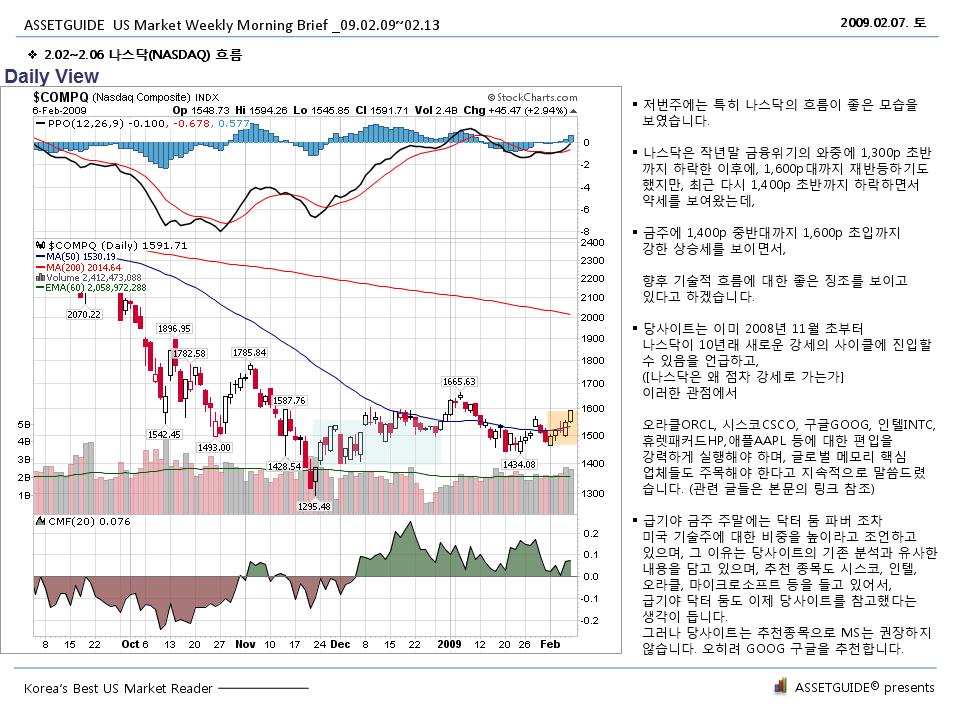
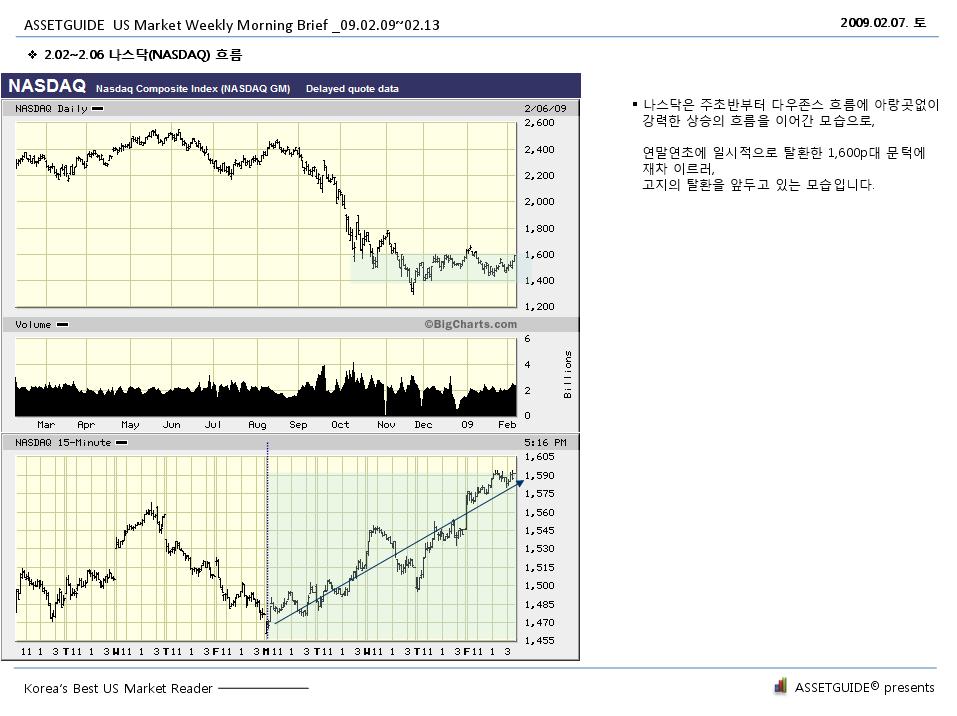
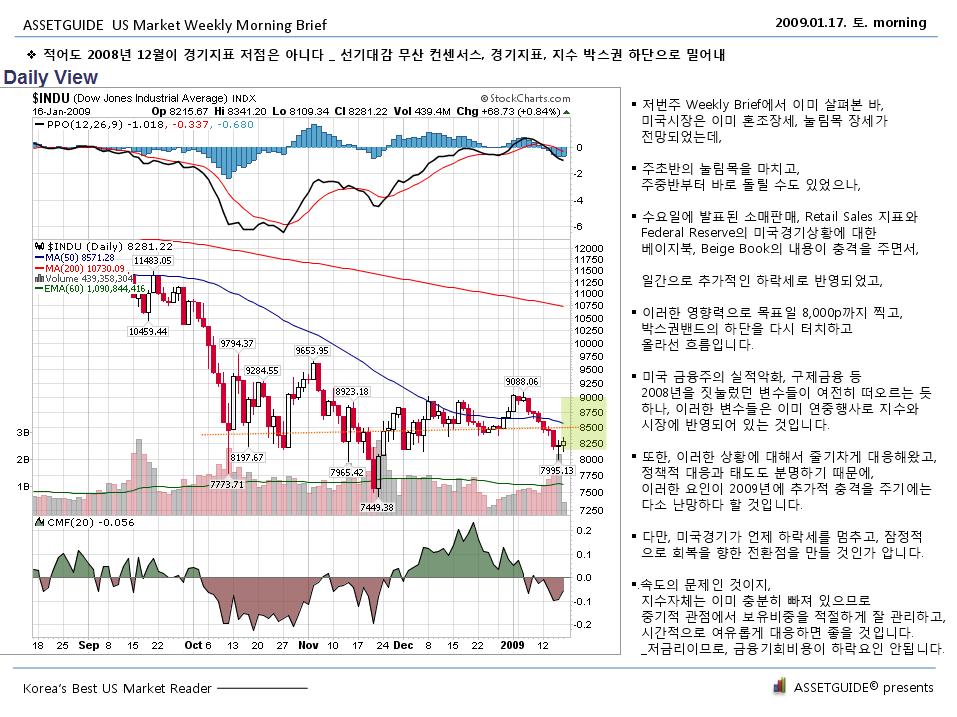
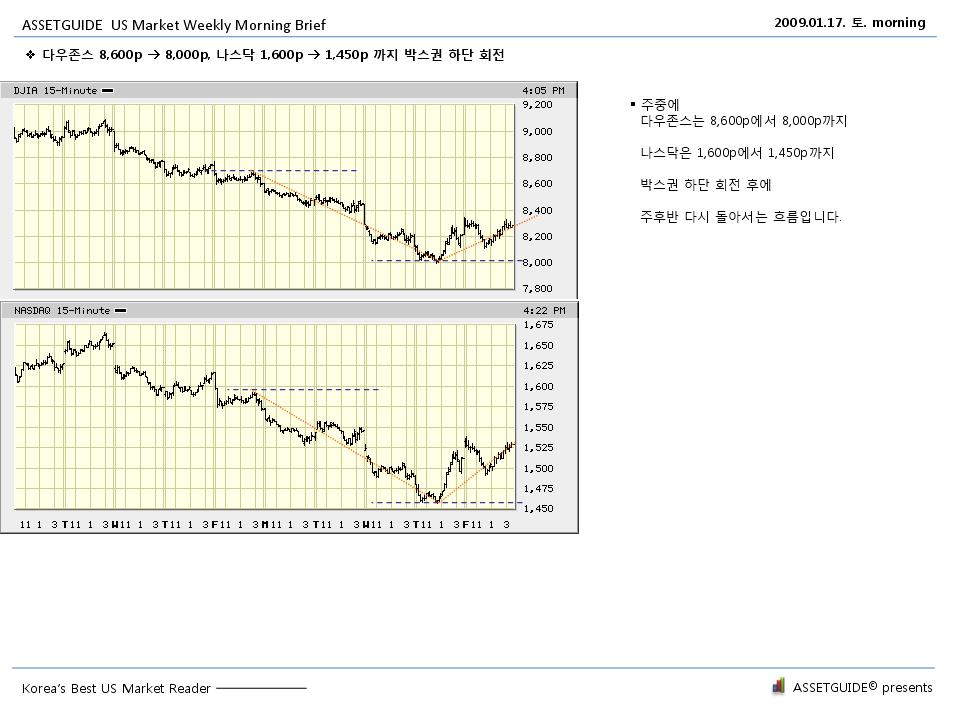
다우존스, 나스닥 지수 _09.07.16 (현지)
다우존스, 나스닥 지수도 일간 조금 더 오른 모습입니다.
이하, 미국 노동부의 발표자료입니다. (출처 : 미국 노동부, U.S. Department of Labor)
|
EMPLOYMENT AND TRAINING ADMINISTRATION |
USDL 09-817-NAT |
|
|
|
|
|
|
|
Program Contact: |
TRANSMISSION OF MATERIAL IN THIS |
|
Scott Gibbons (202) 693-3008 |
RELEASE IS EMBARGOED UNTIL |
|
Tony Sznoluch (202) 693-3176 |
8:30 A.M. (EDT), THURSDAY |
|
Media Contact : |
July 16, 2009 |
|
(202) 693-4676 |
|
|
|
|
UNEMPLOYMENT INSURANCE WEEKLY CLAIMS REPORT
SEASONALLY ADJUSTED DATA
In the week ending July 11, the advance figure for seasonally adjusted initial claims was 522,000, a decrease of 47,000 from the previous week's revised figure of 569,000. The 4-week moving average was 584,500, a decrease of 22,500 from the previous week's revised average of 607,000.
The advance seasonally adjusted insured unemployment rate was 4.7 percent for the week ending July 4, a decrease of 0.5 percentage point from the prior week's revised rate of 5.2 percent.
The advance number for seasonally adjusted insured unemployment during the week ending July 4 was 6,273,000, a decrease of 642,000 from the preceding week's revised level of 6,915,000. The 4-week moving average was 6,666,750, a decrease of 110,250 from the preceding week's revised average of 6,777,000.
The fiscal year-to-date average for seasonally adjusted insured unemployment for all programs is 5.449 million.
UNADJUSTED DATA
The advance number of actual initial claims under state programs, unadjusted, totaled 667,534 in the week ending July 11, an increase of 86,389 from the previous week. There were 483,981 initial claims in the comparable week in 2008.
The advance unadjusted insured unemployment rate was 4.6 percent during the week ending July 4, an increase of 0.1 percentage point from the prior week. The advance unadjusted number for persons claiming UI benefits in state programs totaled 6,135,066, an increase of 63,714 from the preceding week. A year earlier, the rate was 2.3 percent and the volume was 3,118,724.
Extended benefits were available in Alaska, Arizona, Arkansas, California, Colorado, Connecticut, the District of Columbia, Florida, Georgia, Idaho, Illinois, Indiana, Kentucky, Maine, Massachusetts, Michigan, Minnesota, Missouri, Montana, Nevada, New Jersey, New York, North Carolina, Ohio, Oregon, Pennsylvania, Puerto Rico, Rhode Island, South Carolina, Tennessee, Vermont, Virginia, Washington, and Wisconsin during the week ending June 27.
Initial claims for UI benefits by former Federal civilian employees totaled 1,642 in the week ending July 4, an increase of 14 from the prior week. There were 1,870 initial claims by newly discharged veterans, a decrease of 192 from the preceding week.
There were 17,471 former Federal civilian employees claiming UI benefits for the week ending June 27, an increase of 17 from the previous week. Newly discharged veterans claiming benefits totaled 28,772, an increase of 242 from the prior week.
States reported 2,525,342 persons claiming EUC (Emergency Unemployment Compensation) benefits for the week ending June 27, an increase of 6,241 from the prior week. EUC weekly claims include both first and second tier activity.
The highest insured unemployment rates in the week ending June 27 were in Michigan (7.2 percent), Puerto Rico (6.9), Oregon (6.5), Pennsylvania (6.3), Nevada (6.1), Wisconsin (5.8), California (5.4), South Carolina (5.4), Connecticut (5.2), Illinois (5.2), New Jersey (5.2), and North Carolina (5.2).
The largest increases in initial claims for the week ending July 4 were in Michigan (+12,144), New York (+8,913), Wisconsin (+5,838), Indiana (+5,430), and Ohio (+4,240), while the largest decreases were in New Jersey (-5,030), California (-4,293), North Carolina (-3,983), Kansas (-3,544), and Oregon
(-1,454).
UNEMPLOYMENT INSURANCE DATA FOR REGULAR STATE PROGRAMS
|
|
Advance |
|
|
|
Prior1 |
|---|---|---|---|---|---|
|
WEEK ENDING |
July 11 |
July 4 |
Change |
June 27 |
Year |
|
Initial Claims (SA) |
522,000 |
569,000 |
-47,000 |
617,000 |
387,000 |
|---|---|---|---|---|---|
|
Initial Claims (NSA) |
667,534 |
581,145 |
+86,389 |
559,857 |
483,981 |
|
4-Wk Moving Average (SA) |
584,500 |
607,000 |
-22,500 |
616,000 |
387,750 |
|
|
Advance |
|
|
|
Prior1 |
|---|---|---|---|---|---|
|
WEEK ENDING |
July 4 |
June 27 |
Change |
June 20 |
Year |
|
Ins. Unemployment (SA) |
6,273,000 |
6,915,000 |
-642,000 |
6,724,000 |
3,169,000 |
|---|---|---|---|---|---|
|
Ins. Unemployment (NSA) |
6,135,066 |
6,071,352 |
+63,714 |
6,078,496 |
3,118,724 |
|
4-Wk Moving Average (SA) |
6,666,750 |
6,777,000 |
-110,250 |
6,757,000 |
3,172,000 |
|
Ins. Unemployment Rate (SA)2 |
4.7% |
5.2% |
-0.5 |
5.0% |
2.4% |
|---|---|---|---|---|---|
|
Ins. Unemployment Rate (NSA)2 |
4.6% |
4.5% |
+0.1 |
4.5% |
2.3% |
INITIAL CLAIMS FILED IN FEDERAL PROGRAMS (UNADJUSTED)
|
|
|
|
|
Prior1 |
|---|---|---|---|---|
|
WEEK ENDING |
July 4 |
June 27 |
Change |
Year |
|
Federal Employees |
1,642 |
1,628 |
+14 |
1,402 |
|---|---|---|---|---|
|
Newly Discharged Veterans |
1,870 |
2,062 |
-192 |
1,378 |
PERSONS CLAIMING UI BENEFITS IN FEDERAL PROGRAMS (UNADJUSTED)
|
|
|
|
|
Prior1 |
|
WEEK ENDING |
June 27 |
June 20 |
Change |
Year |
|
Federal Employees |
17,471 |
17,454 |
+17 |
11,468 |
|
Newly Discharged Veterans |
28,772 |
28,530 |
+242 |
18,903 |
|
Railroad Retirement Board |
10,000 |
10,000 |
0 |
2,000 |
|
Extended Benefits |
285,874 |
346,559 |
-60,685 |
1,726 |
|
EUC 20083 |
2,525,342 |
2,519,101 |
+6,241 |
0 |
FOOTNOTES
SA - Seasonally Adjusted Data
NSA - Not Seasonally Adjusted Data
1 - Prior year is comparable to most recent data.
2 - Most recent week used covered employment of 133,078,480 as denominator.
3 - EUC weekly claims include both first and second tier activity.
실업률 관련글 보기
|
| |||||
'Market(o)' 카테고리의 다른 글
| 코스피 전망 _증시 과열, 차익실현 나서라 _09.07.27 (0) | 2009.07.27 |
|---|---|
| 2009년 2분기 GDP, 국내총생산, 경제성장률 -2.5% 감소_한국은행 _09.07.24 (0) | 2009.07.24 |
| 미국 산업생산, Industrial Production 7월 -0.4% _09.07.16 (0) | 2009.07.16 |
| 미국증시, 다우지수 급등의 원인 _8,616p _09.07.16 _엠파이어 스테이트 제조업 지수, Empire State Manufacturing Index (1) | 2009.07.16 |


 7_2009.pdf


