--> I'm Lucky 최근글 <--

'미국경제'에 해당되는 글 43건


  1. 2009.02.13 미국 기업재고, Business Inventories 월간 변화 _09.02.12
  2. 2009.01.31 미국증시 주간전망 _09.02.02~02.06 _경기개선 지연, 추가하락파 경계 단계
  3. 2009.01.31 미국 GDP, 경제성장률, -3.8% _내용부정적 _경기회복 지연 전망
 
다음은 미국 통계국, Census Bureau가 발표한 기업재고량 월간 변화율입니다.
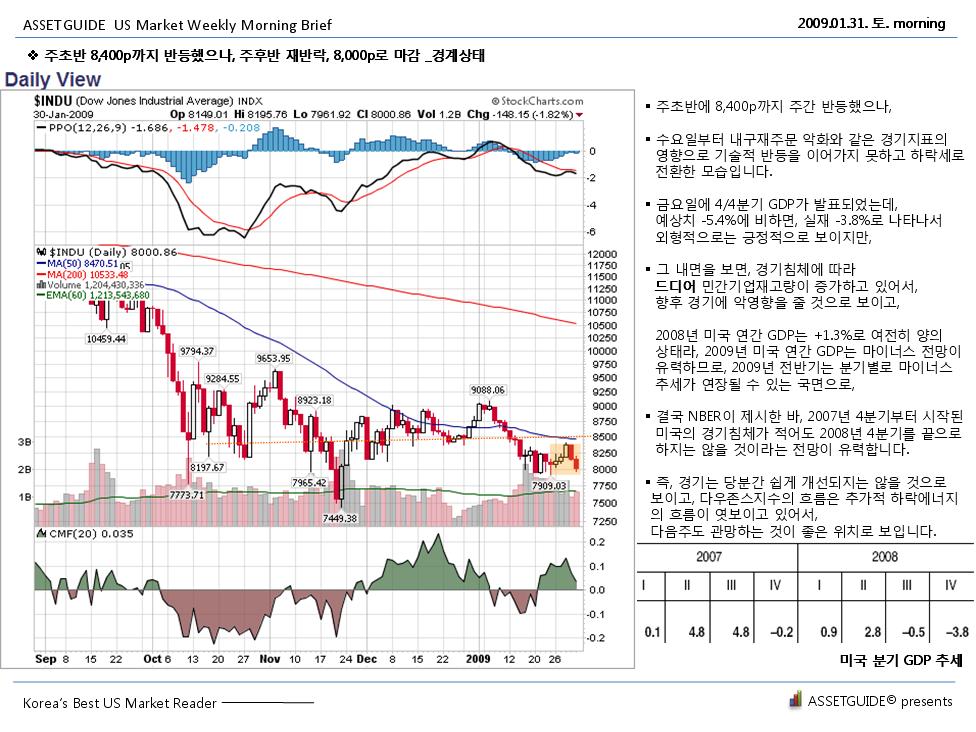
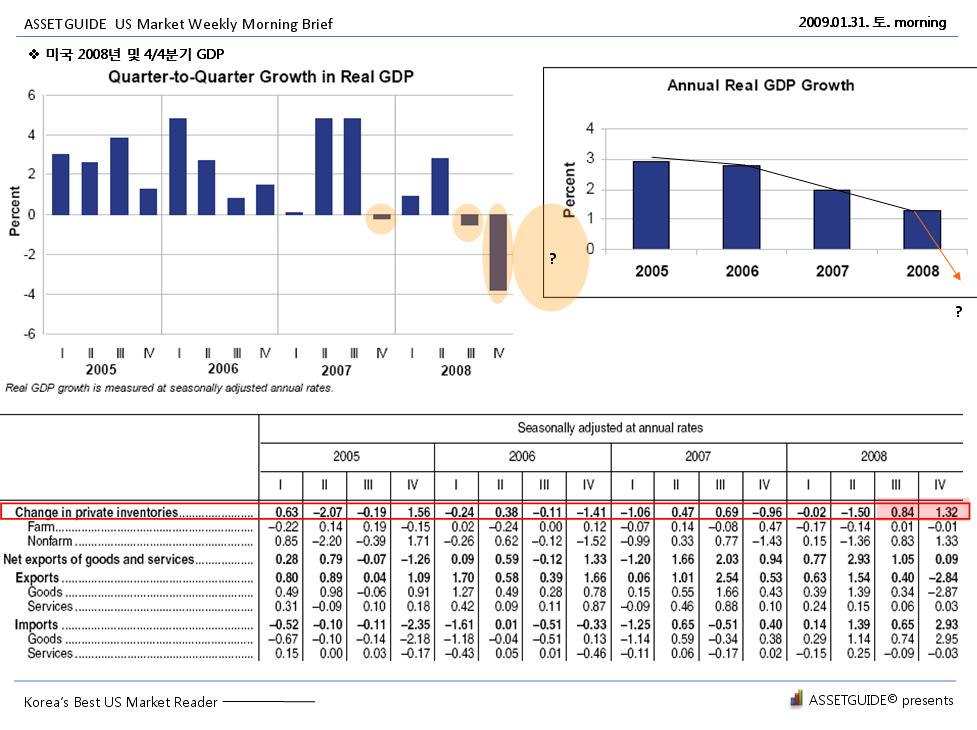
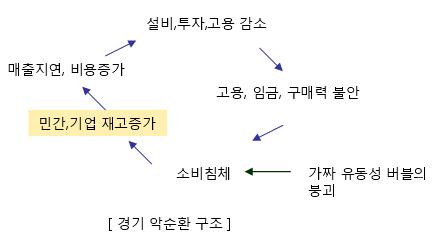
기업재고/매출 비율이 2008년 중반부터 급격하게 오르고 있고, 이런 추세가 여전히 꺼지지 않고 있어서, 소비침체는 계속 진행 중이라고 볼 수 있습니다.


Census Bureau

FOR IMMEDIATE RELEASE

THURSDAY, FEBRUARY 12, 2009, AT 10:00 A.M. EST


Timothy Winters (Retail): (301) 763-2713                                                                                                                            CB09-21
John Miller (Wholesale): (301) 763-2703
Chris Savage (Manufacturing): (301) 763-4832

MANUFACTURING AND TRADE INVENTORIES AND SALES
December 2008

INTENTION TO REVISE: Revisions to the Wholesale and Retail adjusted and not adjusted monthly estimates for sales and inventories are scheduled for release in March 2009 and April 2009, respectively. Estimates will be revised to reflect the results of the 2007 Annual Wholesale and Annual Retail Trade Surveys. Manufacturing estimates will be revised at a later date. Revisions to the Wholesale data will be reflected in the February 2009 Manufacturing and Trade Inventories and Sales (MTIS) release scheduled for April 14, 2009. Revisions to the Retail data will be reflected in the March 2009 MTIS release scheduled for May 13, 2009.

Sales. The U.S. Census Bureau announced today that the combined value of distributive trade sales and manufacturers’ shipments for December, adjusted for seasonal and trading-day differences but not for price changes, was estimated at $1,016.6 billion, down 3.2 percent (±0.2%) from November 2008 and down 11.8 percent (±0.3%) from December 2007.

Inventories. Manufacturers’ and trade inventories, adjusted for seasonal variations but not for price changes, were estimated at an end-of-month level of $1,460.5 billion, down 1.3 percent (±0.1%) from November 2008, but up 0.9 percent (±0.4%) from December 2007.

Inventories/Sales Ratio. The total business inventories/sales ratio based on seasonally adjusted data at the end of December was 1.44. The December 2007 ratio was 1.26.


The Manufacturing and Trade Inventories and Sales Report for January is scheduled to be released March 12, 2009 at 10:00 a.m. EDT.


For information, visit the Census Bureau’s Web site at <http://www.census.gov/bussales>. This report is also available the day of issue through the Department of Commerce’s STAT-USA (202-482-1986).

* The 90 percent confidence interval includes zero. The Census Bureau does not have sufficient statistical evidence to conclude that the actual change is different from zero.


Table 1. Estimated Monthly Sales and Inventories for Manufacturers, Retailers, and Merchant Wholesalers
(In millions of dollars)

See footnotes and notes at the end of Table 3.

(p) Preliminary estimate.
(r) Revised estimate.


Table 2. Percent Changes for Sales and Inventories--Manufacturers, Retailers, and Merchant Wholesalers


Table 3. Estimated Monthly Retail Sales, Inventories, and Inventories/Sales Ratios, By Kind of Business
(In millions of dollars)

(p) Preliminary estimate.
(r) Revised estimate.

1 Inventories are on a non-LIFO basis as of the end of the month.
2 Adjusted for seasonal variations and, in the case of sales, for trading-day differences and holiday variations. Concurrent seasonal adjustment is being used to adjust all sales, shipment, and inventory estimates. Concurrent seasonal adjustment uses all available unadjusted estimates as input to the X-12-ARIMA program. The factors derived from the program are applied to the current and previous month estimates and for retail and wholesale estimates a year ago as well. For retail sales, concurrent seasonal adjustment is also used to adjust the advance estimates (published one month before the preliminary estimates) and the estimates one year before the advance month. This explains the revision to retail estimates from a year ago.
3 Manufacturers sales refer to the value of shipments by manufacturers. The shipments data from individual manufacturers are adjusted prior to tabulation for the number of trading days as well as for any variations in the length of the reporting period.
4 The 2002 North American Industry Classification System (NAICS) defines merchant wholesalers as including manufacturers' sales branches and offices. However, the estimates included in this release exclude manufacturers' sales branches and offices. Note that this is not a change in coverage from prior releases and is consistent with the description used in the Monthly Wholesale Trade Survey data products.

Note: U.S. and group totals include kinds of business not shown. The Manufacturing and Trade Inventory and Sales estimates are based on data from three surveys: the Monthly Retail Trade Survey, the Monthly Wholesale Trade Survey, and the Manufacturers’ Shipments, Inventories, and Orders Survey. The sampling variability for retailers and merchant wholesalers can be used to construct a 90 percent confidence interval for the estimates. Over all possible samples, 90 percent of such intervals will cover the true estimate. These intervals are given in parentheses for the estimates on the front page. If, for example, the estimate is up 0.8 percent and the margin of sampling error is ±1.2 percent, the 90 percent confidence interval is -0.4 percent to +2.0 percent. If the range contains 0, it is uncertain whether there was an increase or decrease. Measures of reliability for Retail and Wholesale sales and inventory levels and changes are included in the detailed monthly press releases for those Industries. Manufacturers do not contribute to estimates of sampling variability because the manufacturer’s mail panel is not a probability sample from a known frame and standard errors of the industry estimates cannot be calculated. Estimates from all three surveys are also subject to nonsampling errors, which can arise in any stage of the survey. Such errors include coverage error (failure to accurately represent all population units in the sample), response errors, coding errors, and nonresponse. Although no direct measurement of these errors has been obtained, precautionary steps were taken in all phases of the collection, processing, and tabulation of the data to minimize their influence.

Horizontal Rule
Source: Retail Indicators Branch, U.S. Census Bureau | Last Revised: February 12, 2009

미국경제, 미국 경기지표, 기업재고, 재고량, 재고율, 매출, Business Inventories, Sales Ratio   


맞춤검색

,


그림을 클릭하면 잘 나옵니다. 


ASSETGUIDE  US Market Weekly Morning Brief _09.02.02~02.06

주초반 8,400p까지 반등했으나, 주후반 재반락, 8,000p로 마감 _경계상태
주초반에 8,400p까지 주간 반등했으나, 수요일부터 내구재주문 악화와 같은 경기지표의 영향으로 기술적 반등을 이어가지 못하고 하락세로 전환한 모습입니다.

금요일에 4/4분기 GDP가 발표되었는데, 예상치 -5.4%에 비하면, 실재 -3.8%로 나타나서 외형적으로는 긍정적으로 보이지만,
그 내면을 보면, 경기침체에 따라 드디어 민간기업재고량이 증가하고 있어서, 향후 경기에 악영향을 줄 것으로 보이고,

2008년 미국 연간 GDP는 +1.3%로 여전히 양의 상태라, 2009년 미국 연간 GDP는 마이너스 전망이 유력하므로,
2009년 전반기는 분기별로 마이너스 추세가 연장될 수 있는 국면으로,
 
결국 NBER이 제시한 바, 2007년 4분기부터 시작된 미국의 경기침체가 적어도 2008년 4분기를 끝으로 하지는 않을 것이라는 전망이 유력합니다.

즉, 경기는 당분간 쉽게 개선되지는 않을 것으로 보이고, 다우존스지수의 흐름은 추가적 하락에너지의 흐름이 엿보이고 있어서, 다음주도 관망하는 것이 좋은 위치로 보입니다.


초반 반등했으나, 주중반부터 경기지표 반영하며 침강 상태

[일일추세]

연말연초 9,000p까지의 반등을 끝으로, 추세를 이어가지 못하고, 8,000p 까지 최근 4/4분기의 박스권 하단까지 크게 밀려있는 흐름인데,
반등의 에너지가 약해지고, 하락에너지가 쌓이고 있어서, 밑으로의 추가적 에너지 분출도 배제할 수 없는 흐름이어서, 다음주에도 관망, 경계가 필요하다고 생각됩니다.

[최근 10일 추세]
저저번주부터 확인된 경기지표가 4/4분기를 저점권으로 하는 경기국면의 바닥권에 대한 선기대감을 무산시킨 국면으로,
이러한 흐름은 이번주까지 이어져서, 내구재주문과, 4/4분기 GDP 등의 영향으로, 8,000p까지 밀려있는 국면입니다.

전반적으로 7,000p권으로 하회할 가능성이 높아보이므로, 경계  필요합니다.


1.26~1.30 주요 경기지표 _ 내구재주문 악화, GDP발표치 외형은 기대이상이나 실질은 악화

내구재주문이 예상보다 악화되어서 생산현장에서의 개선 기미가 아직 멀었음을 보여주고 있으며, 시카고 제조업지수도 근래 최저치를 기록하고 있습니다.

또한 GDP의 형식적 수치 개선에 기여했다고 하는, 민간/기업재고량이 드디어 2분기 이상 쌓이고 있는데, 
이는 생산 및 소비가 지체되어, 재투자와 민간구매력 복원이 지체되고, 다시 소비침체가 반복되는, 경기 악순환 구조를 암시하고 있어서,

이러한 악순환 구조를 가시적으로 끊어어줄 수 있는 인위적 Spark가 조기에 발생하지 않는다면, 경기침체는 개선되기 보다는 당분간 계속될 가능성이 커 보입니다.


2.2~2.6 주요 경기발표 일정 _ 비농업고용인수, 주간실업청구건수, 공장재주문, 실업률 지표

다음주 다우존스는 기술적 흐름상 부정적 전망이 일단 우세해 보입니다.

다음주 주요 경기지표를 보면, 최근 1분기이래 시장에 충격을 주었던 내용들입니다.
_ 비농업고용인수, 주간실업청구건수, 공장주문, 실업률

이러한 지표들이 여전히 개선되지 않으면, 시장은 다소 의기소침할 것이고,  더 악화된 것으로 나온다면, 추가충격이 가능해 보여서 경계가 필요해 보입니다.

전반적으로 미국시장은 시장의 자율적 흐름으로는 위기의 구조와 침체상태를 쉽게 벗어날 수 없는 국면으로,
결국 정부와 당국의 계속된 유동성개선 정책 이후로, 실질적이고 가시적인 어떤 재정/사회/SOC정책을 효과적으로, 단계적으로, 그리고 조속하게 추진하여서,
시장에 Spark(추동력)를 줄 수 있을 것인가가 남아있는 희망, 주요 변수라 하겠습니다.

즉, 이제는 유동성개선 대책 이후로, 실질적 재정/사회/SOC정책이 집행, 시작되야 하는데, 그 내용과 속도, 효과에 따라 시장의 개선 시기가 결정될 것입니다.

현재는 아무 것도 시작된 것은 없으므로, 이른 시점이라고 하겠습니다.


맞춤검색

,

그림을 클릭하면 잘 나옵니다.
다음은 BEA, Bureau of Economic Analysis 가 발표한 미국 실질GDP 2008년 연간 및 2008년 4분기 추세입니다.
전반적으로 향후 전망에 대해 부정적인 흐름을 시사한다고 볼 수 있습니다. 이유는,


1) 민간재고(기업재고)량이 2008년 3분기부터 3분기 0.84%, 4분기 1.32%씩 늘어나고 있는데, 재고증가는 경기침체가 결국 경기에 지속적인 악영향을 주기 시작했다는 증거,
(change in private inventories 항목)
2) NBER이 2007년 4분기부터 경기침체를 선언했는데, 2008년 1분기와 2분기에 일시적으로 양의 성장률을 보인 이후에, 2008년 3분기부터 GDP성장률이 다시 침체로 돌아서서, 이러한 본(本) 추세가 당분간 계속될 것으로 보인다는 점,

3) 분기별 경기침체에도 불구하고, 2008년 연간 1.3%의 양의 성장률을 기록하여, 경기침체가 연간성장률에 분명하게 각인된다면, 2009년은 연간으로 마이너스 성장률이 유력하다는 점,

4) 재고증가는 소비침체로 인해 판매가 일어나지 않는다는 것으로 기업에게 계속 재고/관리 부담을 주게 되고, 새로운 생산과 투자를 꺼리게 만들어, 설비 및 투자, 고용도 줄이도록 하는 요인이 되고, 이로 인해 민간의 구매력 복구도 지연, 약화되므로 다시 소비침체를 일으키는 악순환이 반복된다.

5) 실지로 미국 4분기 GDP수치를 보면, 소비지출은 -3.5% 감소, 기업투자 -20.1% 감소, 수출 -19.7% 감소를 보였다. 오직 정부지출만 1.9% 증가하여 GDP악화 개선에 기여했으며,
민간/기업재고증가 1.32% 수치를 빼면 4분기 GDP는 -5.1% 추락한 것으로 볼 수 있어,  긍정적인 내용은 아니다. (이데일리 관련기사) 


REAL GDP DECLINES 3.8 PERCENT IN FOURTH QUARTER, “Advance” Estimate of GDP, FRIDAY, January 30, 2009 
(
* 이하 거친한글 해석  클릭)

Real gross domestic product (GDP) declined 3.8 percent in the fourth quarter of 2008 after declining 0.5 percent in the third quarter, according to estimates released today by the Bureau of Economic Analysis.

The fourth-quarter decline in real GDP reflected the following:
• A sharp downturn in exports, the first decline since the second quarter of 2003
• A decline in consumer spending, similar to the third-quarter decline
• A much larger decline in business investment in structures, equipment and software
• A continuing decline in housing

Offsetting these components:
• A larger decline in imports, which are a subtraction in the calculation of GDP
• An increase in inventory investment

Consumer prices
Consumer prices fell 5.5 percent in the fourth quarter, after rising 5.0 percent in the third quarter. Excluding food and energy, prices rose 0.6 percent after rising 2.4 percent.

2008 growth
Real economic growth was 1.3 percent in 2008, compared with 2.0 percent in 2007, reflecting the following:
• A sharp deceleration in consumer spending
• A downturn in business equipment and software investment

출처 :
http://www.bea.gov/newsreleases/national/gdp/2009/gdp408a.htm


GROSS DOMESTIC PRODUCT: FOURTH QUARTER 2008 (ADVANCE)

Real gross domestic product -- the output of goods and services produced by labor and property located in the United States -- decreased at an annual rate of 3.8 percent in the fourth quarter of 2008, (that is, from the third quarter to the fourth quarter), according to advance estimates released by the Bureau of Economic Analysis. In the third quarter, real GDP decreased 0.5 percent.
The Bureau emphasized that the fourth-quarter “advance” estimates are based on source data that are incomplete or subject to further revision by the source agency (see the box on page 4). The fourth-quarter “preliminary” estimates, based on more comprehensive data, will be released on February 27, 2009.
The decrease in real GDP in the fourth quarter primarily reflected negative contributions fromexports, personal consumption expenditures, equipment and software, and residential fixed investment that were partly offset by positive contributions from private inventory investment and federal government spending. Imports, which are a subtraction in the calculation of GDP, decreased.
Most of the major components contributed to the much larger decrease in real GDP in the fourth quarter than in the third. The largest contributors were a downturn in exports and a much larger decrease in equipment and software. The most notable offset was a much larger decrease in imports.
Final sales of computers subtracted less than 0.01 percentage point from the change in real GDP after subtracting 0.01 percentage point from the third-quarter change. Motor vehicle output subtracted
2.04 percentage points from the fourth-quarter change in real GDP after contributing 0.16 percentage point to the third-quarter change.
The price index for gross domestic purchases, which measures prices paid by U.S. residents, decreased 4.6 percent in the fourth quarter, in contrast to an increase of 4.5 percent in the third. Excluding food and energy prices, the price index for gross domestic purchases increased 1.2 percent in the fourth quarter, compared with an increase of 2.8 percent in the third.
Real personal consumption expenditures decreased 3.5 percent in the fourth quarter, compared with a decrease of 3.8 percent in the third. Durable goods decreased 22.4 percent, compared with a decrease of 14.8 percent. Nondurable goods decreased 7.1 percent, the same as in the third. Services expenditures increased 1.7 percent, in contrast to a decrease of 0.1 percent.
Real nonresidential fixed investment decreased 19.1 percent in the fourth quarter, compared with a decrease of 1.7 percent in the third. Nonresidential structures decreased 1.8 percent, in contrast to an increase of 9.7 percent. Equipment and software decreased 27.8 percent, compared with a decrease of
7.5 percent. Real residential fixed investment decreased 23.6 percent, compared with a decrease of 16.0 percent.
Real exports of goods and services decreased 19.7 percent in the fourth quarter, in contrast to an increase of 3.0 percent in the third. Real imports of goods and services decreased 15.7 percent,compared with a decrease of 3.5 percent.
Real federal government consumption expenditures and gross investment increased 5.8 percent inthe fourth quarter, compared with an increase of 13.8 percent in the third. National defense increased
2.1 percent, compared with an increase of 18.0 percent. Nondefense increased 14.5 percent, compared with an increase of 5.1 percent. Real state and local government consumption expenditures and gross investment decreased 0.5 percent, in contrast to an increase of 1.3 percent.
The real change in private inventories added 1.32 percentage points to the fourth-quarter change in real GDP after adding 0.84 percentage point to the third-quarter change. Private businesses increased inventories $6.2 billion in the fourth quarter, following a decrease of $29.6 billion in the third quarter and a decrease of $50.6 billion in the second.
Real final sales of domestic product -- GDP less change in private inventories -- decreased 5.1 percent in the fourth quarter, compared with a decrease of 1.3 percent in the third.

출처 : http://www.bea.gov/newsreleases/national/gdp/2009/pdf/gdp408a.pdf


맞춤검색

,

(★ 검색으로 결과를 얻어보세요. Let's Search ★)


--> I'm Lucky 최근글 <--